

APCO PowerBI
Visualizing Operational Performance: How APCO Centralized Data with PowerBI
About APCO
Apco is a leader in advanced process control and optimization, with a multidisciplinary team managing a wide range of technical and operational tasks. APCO is a leader in advanced process control and optimization, with a multidisciplinary team managing a wide range of technical and operational tasks. With dozens of engineers logging time across multiple projects, tracking productivity and associated costs was becoming increasingly difficult. The organization needed a centralized solution to visualize billable hours, non-billable time, revenue breakdowns, and expenses in a simple, unified interface.
Industry
Fintech
Service
Technology Department as a Service
What We Did
PowerBI
Custom Team
1 Part-Time Equivalent
Results
Since its launch, the Power BI platform has delivered tangible benefits like
centralized real-time dashboard
giving full visibility into logged hours and employee costs.
increase in visibility
across labor, software, and hardware cost breakdowns.
streamlined reporting process
empowering executives and project leads with instant access to key metrics.
reduction in manual work
by eliminating spreadsheets and automating data consolidation.
Challenge
Before this project, APCO’s operational data, such as hours worked, billing details, and financial summaries, was scattered across spreadsheets and internal tools. Leaders had limited visibility into team productivity, project profitability, and cost breakdowns. The lack of centralized visualization made it difficult to quickly assess performance metrics, compare trends over time, or track costs and revenue across categories. Leadership often had to piece together information manually, slowing down analysis and limiting the speed of decision-making. They needed one place to view everything from real-time hours, financial performance, project summaries, and employee metrics, without clicking through multiple systems or pages.
Solution
Motomtech’s Technology Department as a Service stepped in to convert the research prototype into a scalable, user-ready web platform.
Phase 1
Assessment & Data Audit
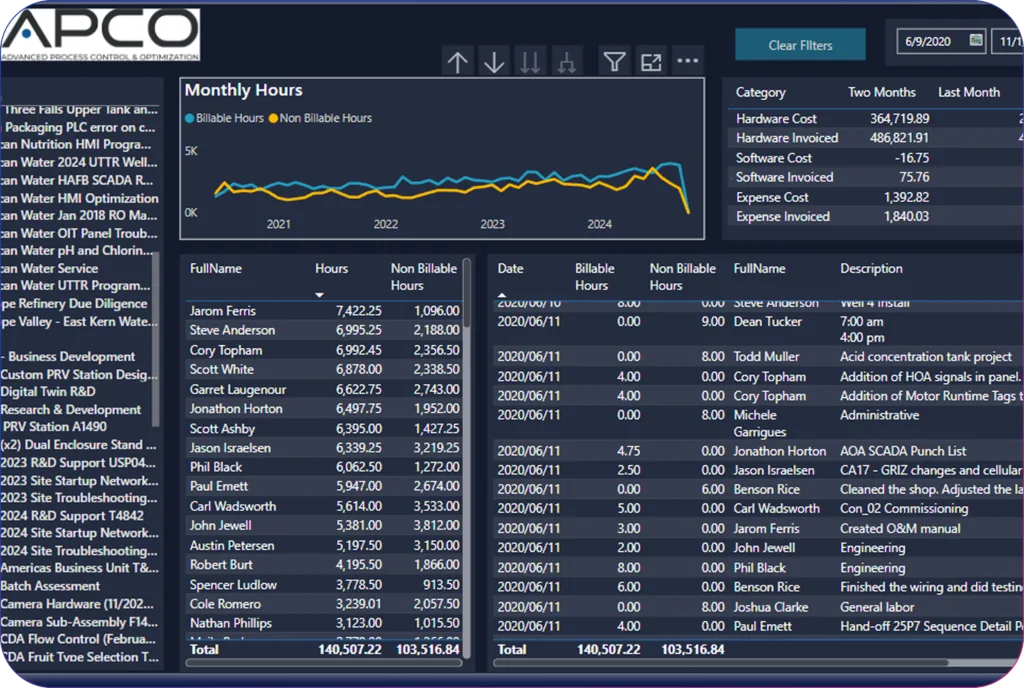
We started with a deep dive into APCO’s existing tracking tools and reporting formats. This included meeting with project managers, financial staff, and engineers to understand the nuances of how hours were logged and which metrics mattered most for day-to-day and long-term reporting. Our team mapped all relevant data sources and created a plan for streamlining them into a unified PowerBI dashboard.
Phase 2
Dashboard Design & Visualization Setup
We built a responsive interface that allows users to filter time ranges, project names, or employees without navigating away from a single screen. We created real-time data visualizations showing trends in billable and non-billable hours, detailed cost summaries, individual and team-level reporting, and a breakdown of labor versus hardware versus software costs. The design emphasized clarity, with readable graphs and tables that update automatically as new data is entered.
Phase 3
Maintenance & Expansion
We continued collaborating with APCO to refine the visuals and expand functionality. This included improving date filtering, fine-tuning category breakdowns, and enhancing the backend logic for calculating gross revenue and profit margin. The solution is now actively used by decision-makers to track company-wide financial performance and resource allocation in real time.
Technology Stack
To ensure a high-performance, scalable, and secure solution, the Power BI platform was built using:
Infrastructure
Power BI
Testimonial
"Motomtech helped us visualize exactly what we needed. With this PowerBI platform, we can now see hours, costs, and revenue streams in one place, with zero friction. The clarity it provides has changed the way we make decisions."
Eric Smith,
President, APCO